Debugger
The Debugger pane enables you to examine the current state of your game in real-time, assisting you in identifying and resolving issues as you develop your game scripts.
You can access the Debugger by clicking to open the pane at the bottom of the Game World view or by selecting Game > Run With Debugging from the menu.
VRAM Preview
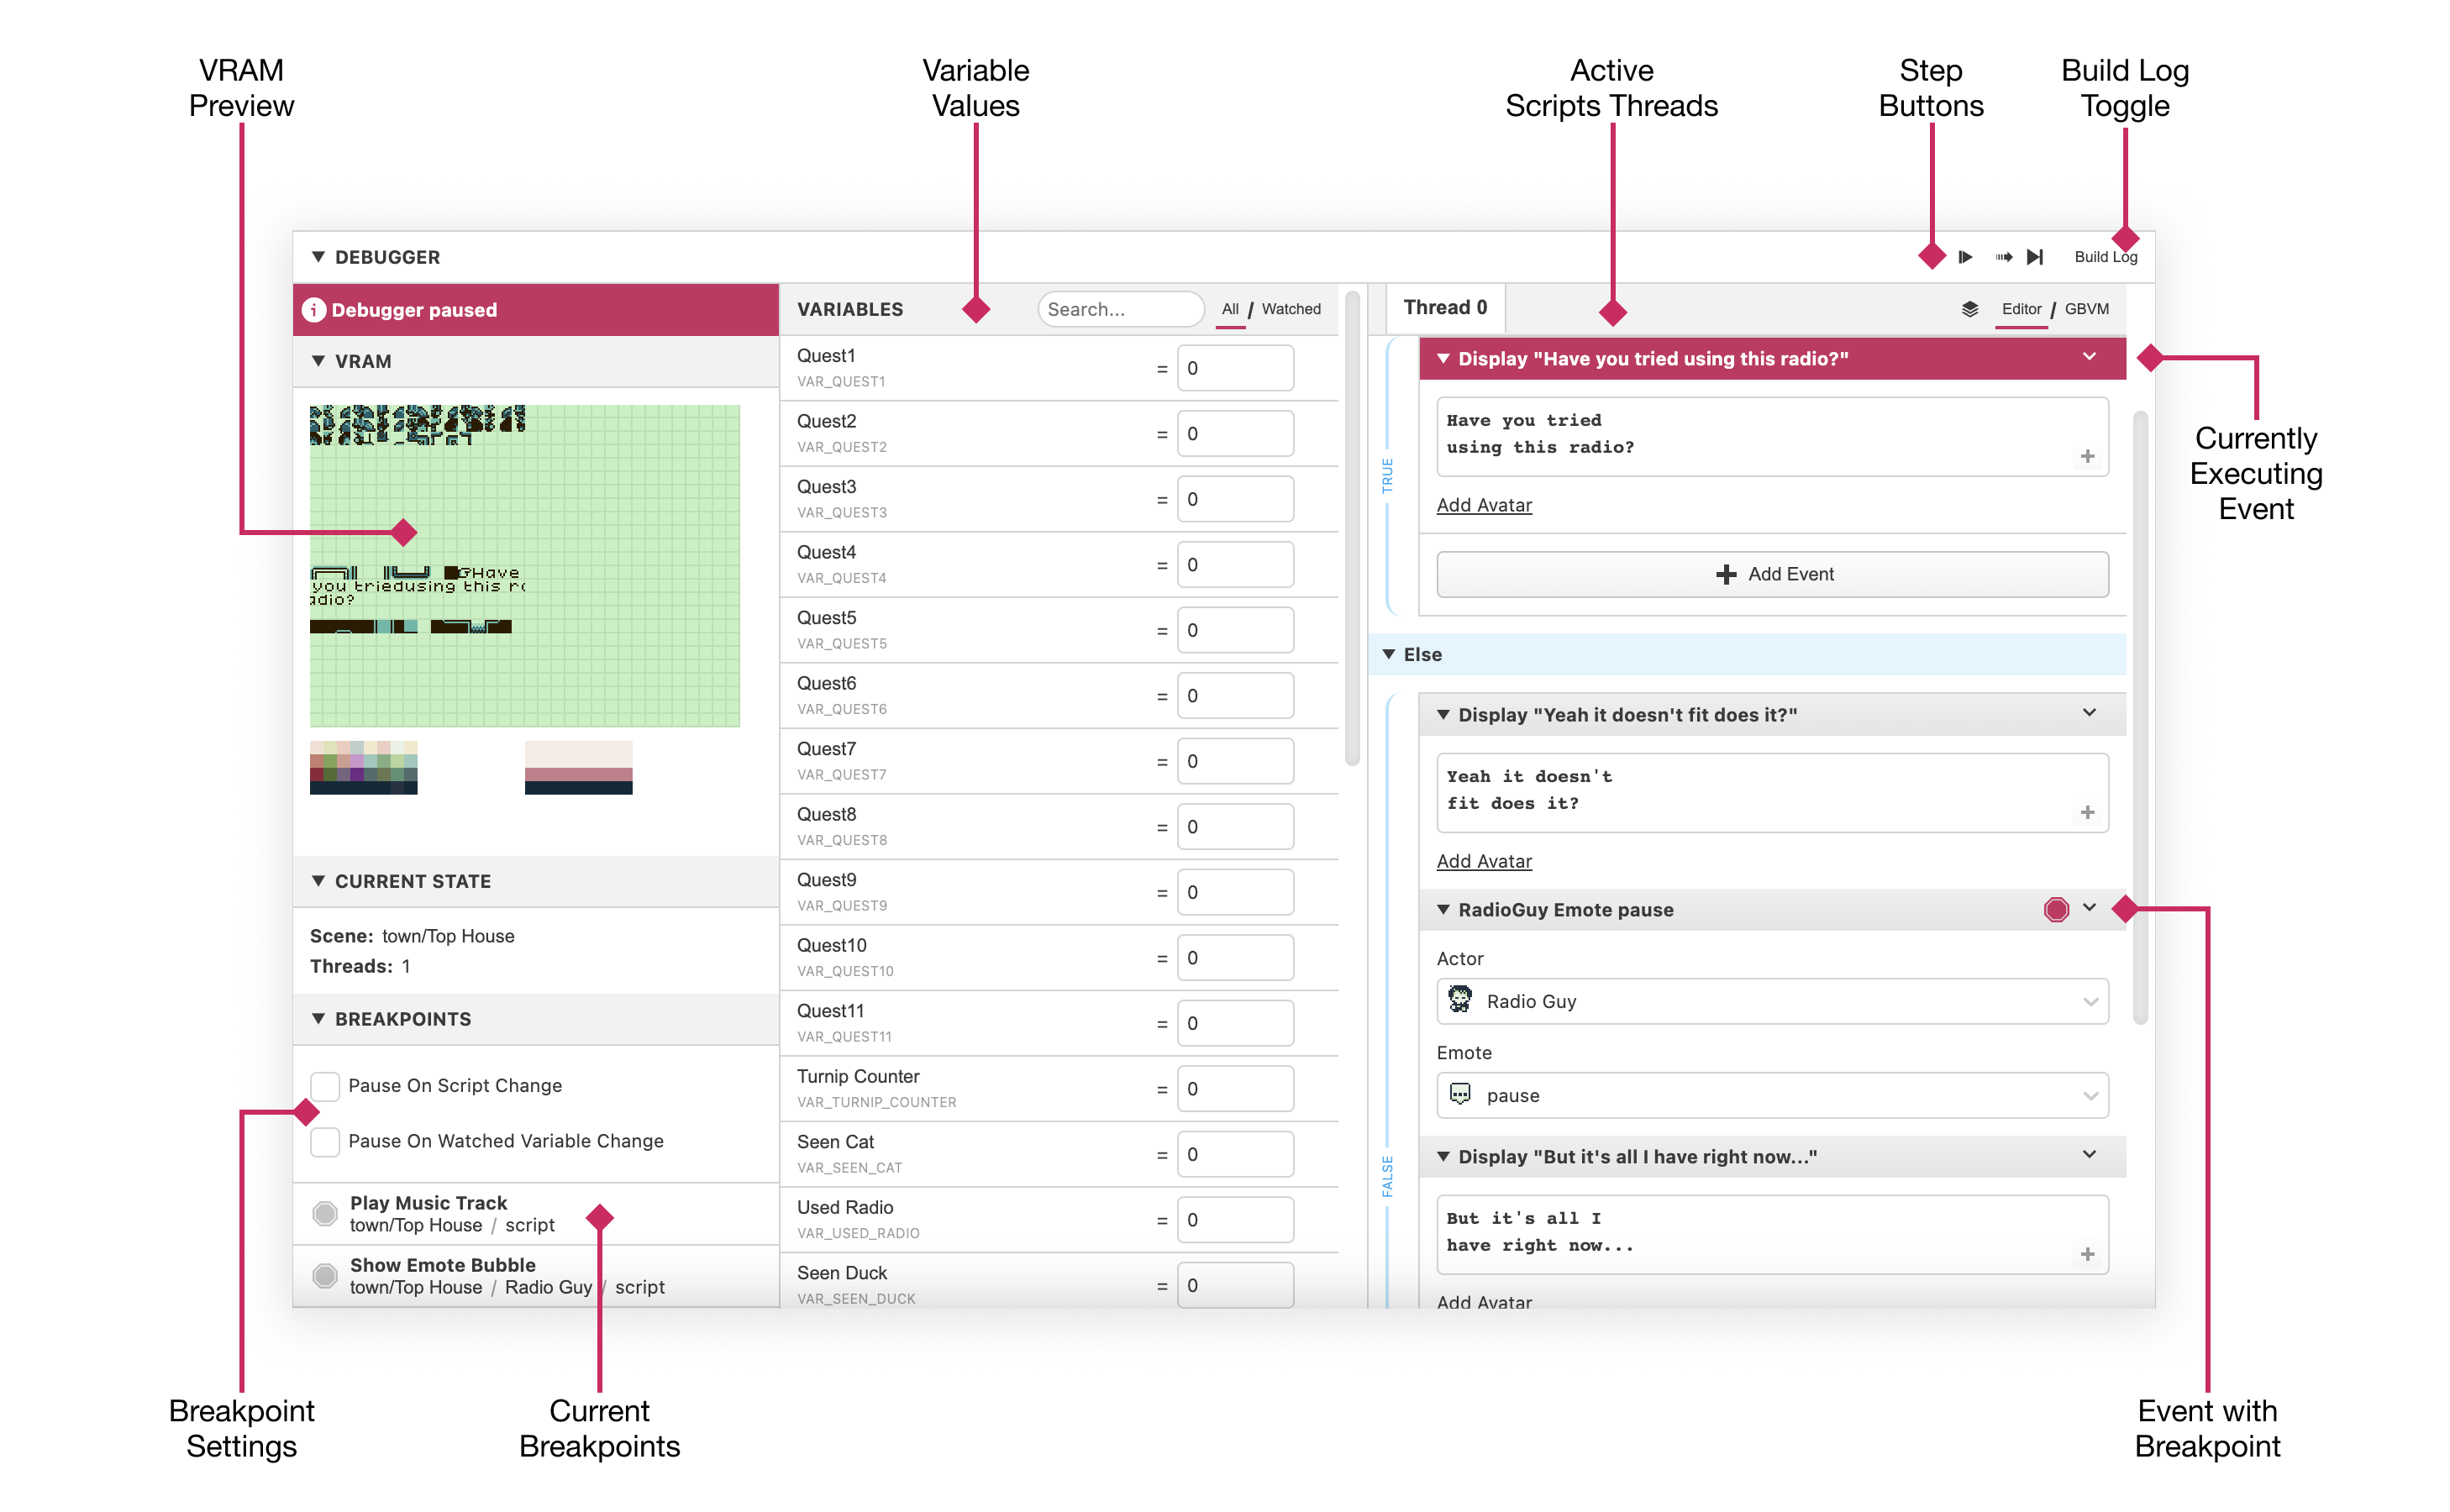
The VRAM pane shows the current video memory used by graphics in your running game.
You can use this pane to get a visual preview of how many additional sprite and background tiles are available in the current scene and to help debug issues when you have used too many unique tiles in the scene.
Below the tiles preview, the pane also shows the 8 background and 8 sprite tile palettes being used for the current scene in color games.
Note that unless you are using Color Only mode then only half of the VRAM is available to your game.
Current State
The Current State pane tells you which scene is currently running in the game and how many script threads are active.
If you click on the current scene's name you will be navigated to that scene in the Game World view.
Breakpoints
The Breakpoints pane consists of some global settings and a list of the current event breakpoints enabled for your project. Breakpoints allow you to pause the running game, allowing you to see what script events were currently running and to view the current value of your game's variables.
-
Pause On Script Change Enabling this setting will cause the debugger to pause whenever a new script is started e.g when you interact with an actor/trigger or load a new scene.
-
Pause On Watched Variable Change Enabling this setting will cause the debugger to pause whenever any script modifies one of your watched variables.
Setting Breakpoints
To set a breakpoint on an event you can use the dropdown button and select "Set Breakpoint" as shown below:
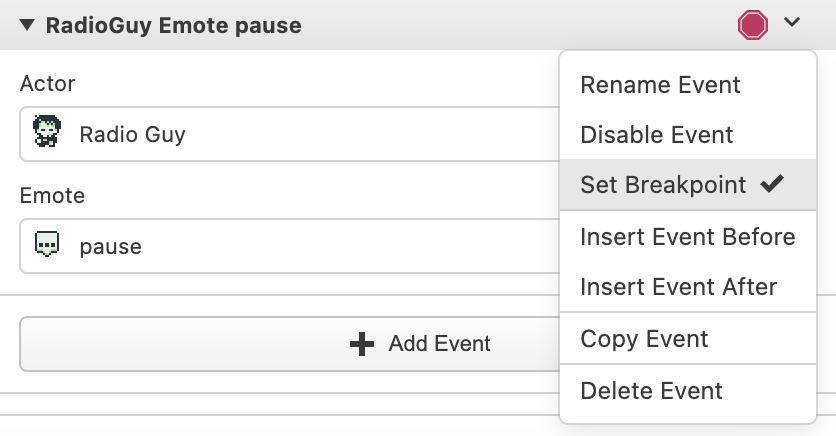
To remove the breakpoint you can either repeat this process, or you can click the x button that will appear when hovering over the entry in the Breakpoints pane.
Variable Values
The Variables pane allows you to see the current value of the variables used within your game. You can also type in new values which will be live updated in your running game.
Watching Variables
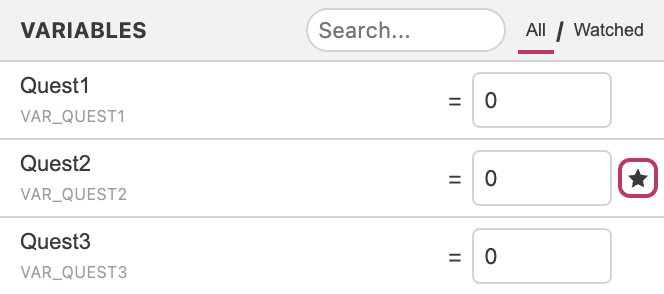
You can watch variables by hovering over the list item and clicking the ★ button that appears on the right. Watching variables allows you to make use of the Pause On Watched Variable Change breakpoints setting.
Active Script Threads
When your game is paused you will be able to navigate through the currently running scripts. You can pause the game either by clicking the ⏸ button at the top right of the debugger, by pressing F8 or by triggering a breakpoint.
Script View
At the top right of the Active Script Threads pane are tabs to switch between viewing the Events Editor (the default) or seeing the generated GBVM script. In the Editor view, you can modify the script including adding and removing events. However, note that any changes made here will not take effect until you rebuild your game.
Stepping Through Your Game
When your game is paused you can use the Step Buttons or keyboard shortcuts to slowly step through your game to follow the progress of any running scripts.
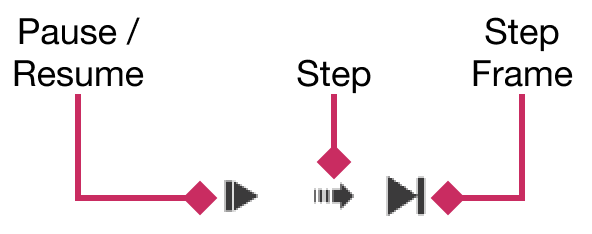
- Pause/Resume Toggles between playing and paused modes.
- Step Run the game until the next script event starts, allowing you to follow through the logic of your scripts.
- Step Forward One Frame Run the game until the next frame of animation starts. This is useful for understanding what is happening every frame during events that take time such as Actor Move To.
Keyboard Shortcuts
When the debugger is enabled, you can use the following keyboard shortcuts in both the Project Window and Play Window:
Pause/Resume - F8
Step Forward One Instruction - F9
Step Forward One Frame - F10
Build Log
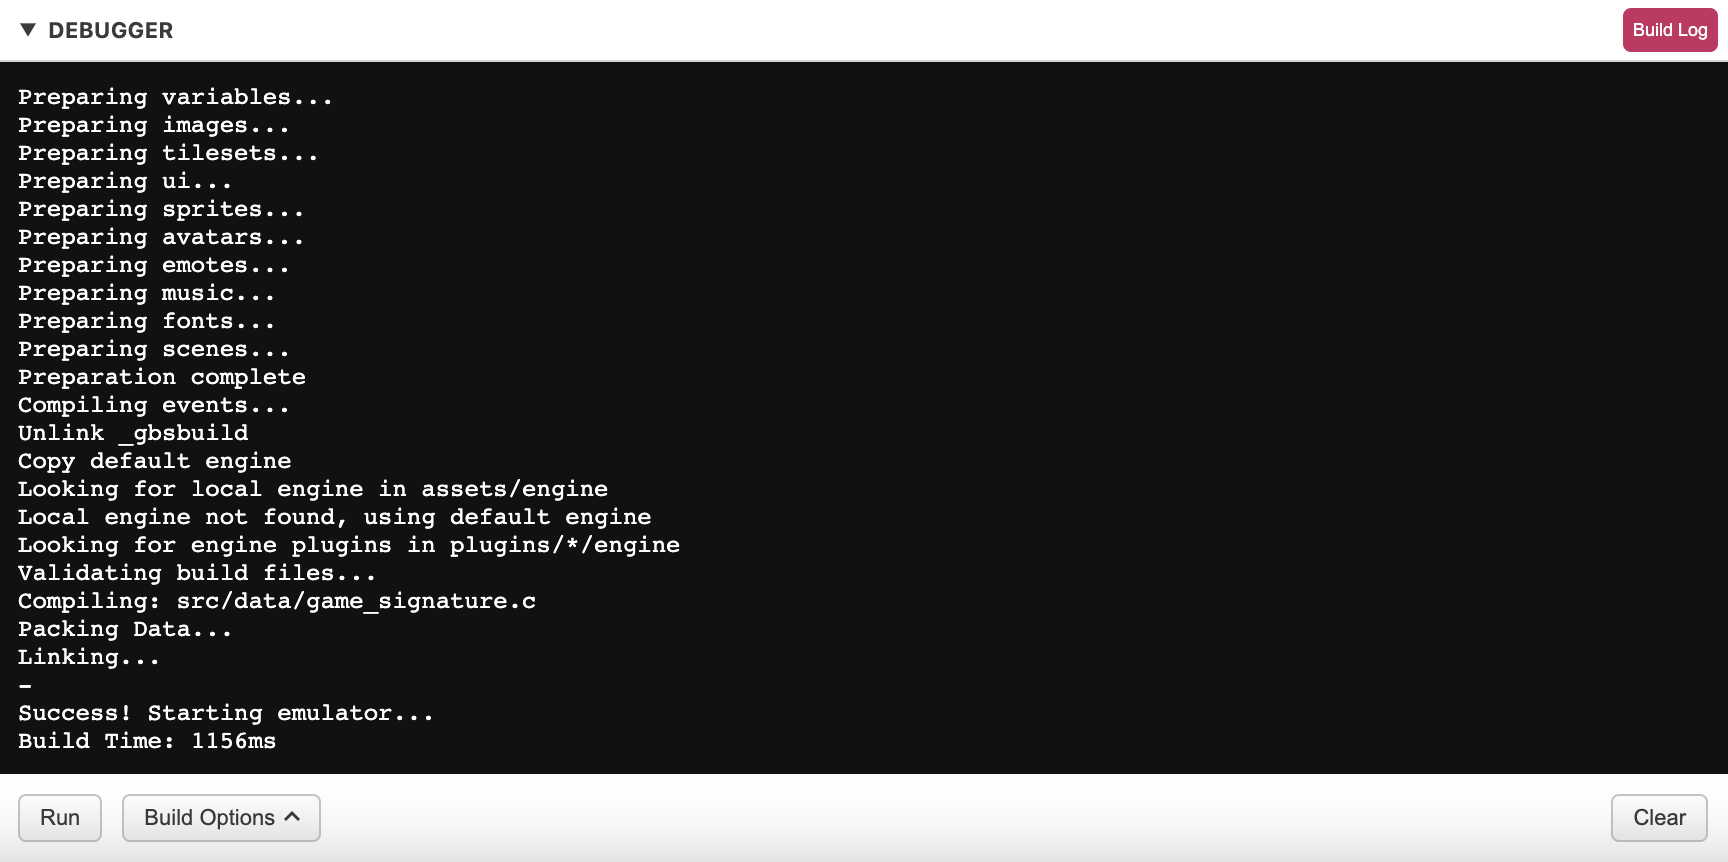
The Build Log allows you to see the current progress as your game is being compiled. It also lists any warnings such as issues with the complexity of your scenes or incompatibility with plugins.
You can access the Build Log by clicking the Build Log toggle button on the top right of the Debugger pane. To dismiss the Build Log you can click the button a second time.
The Build Log will open automatically if your project has warnings, if you would prefer this not to happen you can disable the feature in your project settings.
